Motivation
I have been a part of multiple teams who auto-scale their containerised services horizontally when the average memory usage across all containers exceeds a certain target level. While well-intentioned, this is often completely useless and results in your service scaling to an unnecessary number of containers despite traffic and other resource usage being low.
The purpose of this article is to explain why this happens and convince you that scaling based on container memory usage probably doesn’t do what you think it does.
Assumptions
I’ve used a lot of broad words so far. Let’s get specific about what I mean by “containerised services auto-scaling based on memory usage”.
- Containerised services in this context are applications such as Kubernetes or ECS used to run a HTTP server.
- Memory is specifically memory being consumed from the container’s perspective, not individual processes within the container. This is how tools such as Kubernetes and ECS report memory usage and what they use for their scaling tools such as HPA or Application Auto Scaling.
- Auto-scaling is specifically creating more containers of the same size - horizontal auto-scaling.
- There is an assumption that your service is hosted on relatively standard infrastructure with multiple containers serving HTTP traffic.
- There is an assumption that your service operates as a normal API server that performs relatively standard operations. Such as writing and reading to a database, making 3rd party API requests or adding items to a queue.
There are workloads where memory-based scaling makes sense — for example, batch jobs, in-memory caches, or workers whose throughput is directly limited by heap size. This article focuses on long-running HTTP services.
Saturation
The idea behind auto-scaling is related to the concept of saturation. This is basically how “full” your application is. When an application starts to get full, its performance starts to degrade, hence in any application you should try to measure and monitor saturation.
Your application can become saturated in various ways. In an API server, you are often constrained by things like:
- CPU.
- Threads.
- Database resources.
- Memory.
Why do we auto-scale?
The idea is that when traffic to your service increases and your resources reach saturation, you add more resources automatically so that the service does not become degraded.
Likewise when your application becomes particularly unsaturated, you can scale down resources as to save costs on infrastructure and have less wasted resources.
The problem
If container memory usage is an indication of memory saturation, then when a container reaches close to 100% of its memory usage we would expect the container’s performance to degrade. In this context, we might expect that the container can no longer serve traffic or is OOM killed by the container host.
When we look at memory usage in certain runtimes however, we find this is not the case. So container memory usage is not an indicator of memory saturation. In fact, measuring memory saturation is often quite difficult.
I will prove the above statement in a few examples.
Ruby runtime
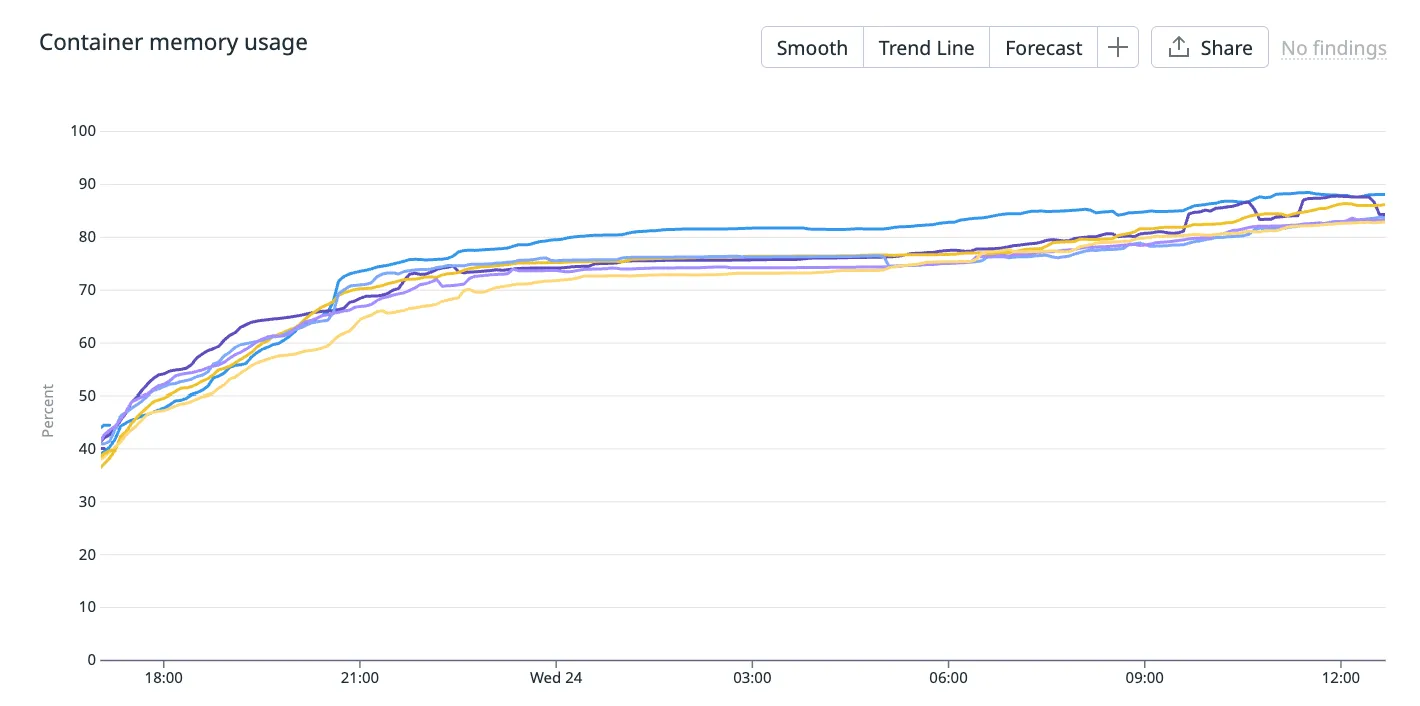
Below is the container memory usage (%) of a Ruby on Rails server running in production.
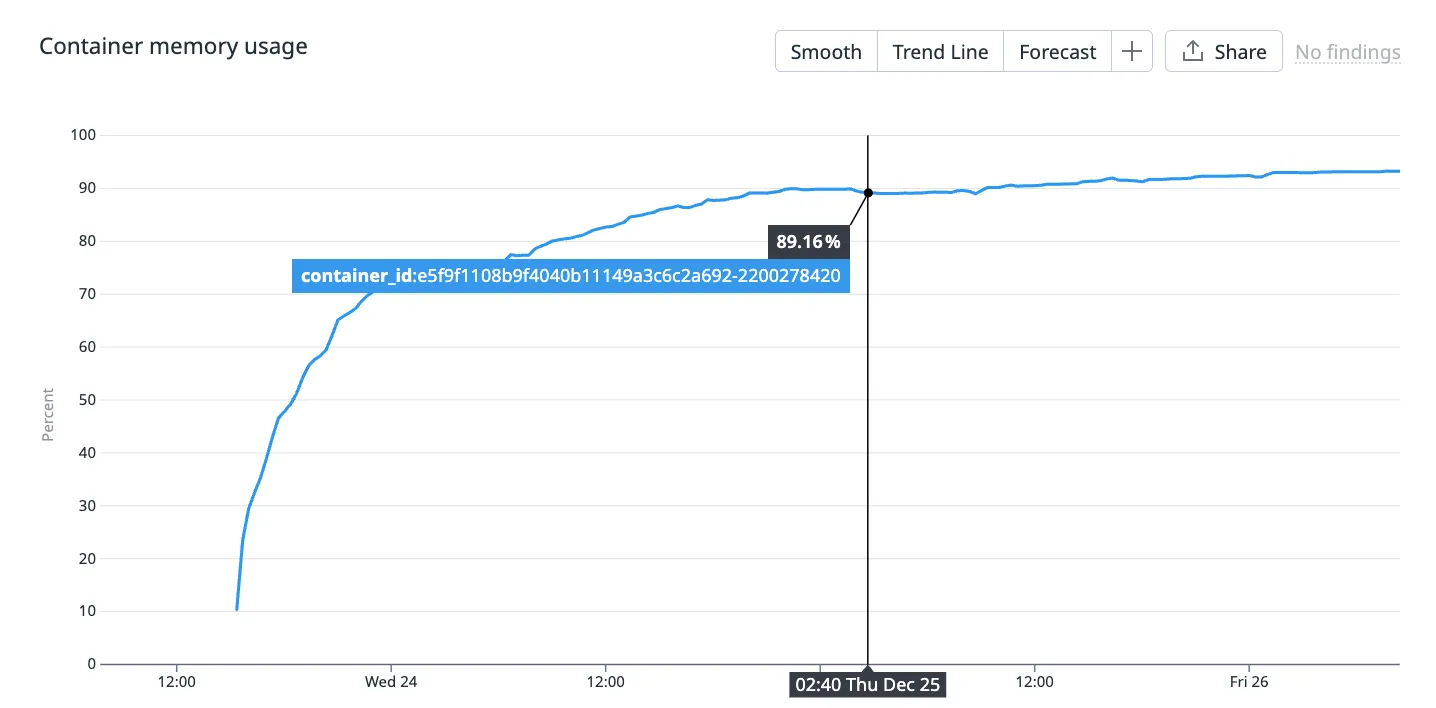
This container has been alive for a couple of days and you can see its memory usage gradually approaching 100%.
Side note: this container serves traffic for a product that receives traffic on a daily cycle - it peaks during the day and reaches nearly 0 at night. So the fact that memory usage doesn’t correlate with traffic is a hint that it’s not an indicator of resource saturation.
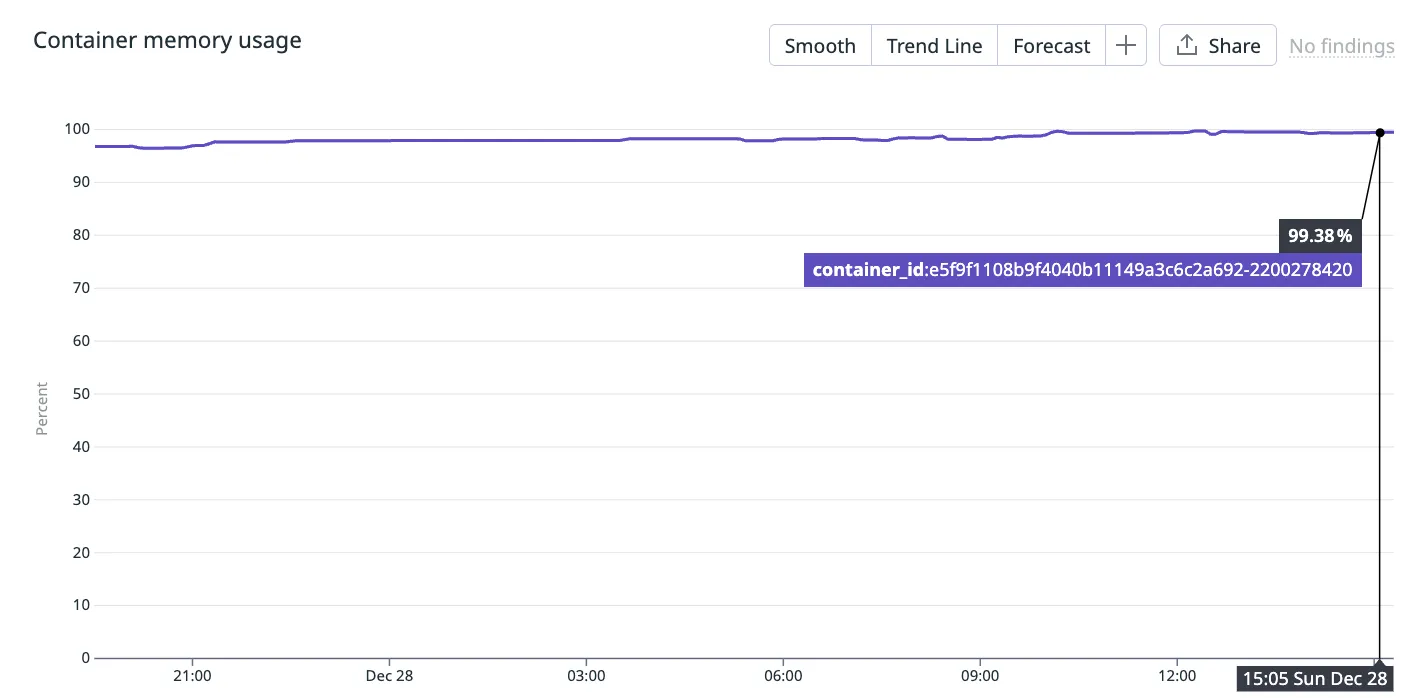
Fast forward another few days and you can see that container memory usage reaches 99.38%! This is where the consulting company you pay to be experts on your infrastructure phone you up and warn you about high memory usage in your containers.
“Line has gone up! Service about to crash!” they proclaim.
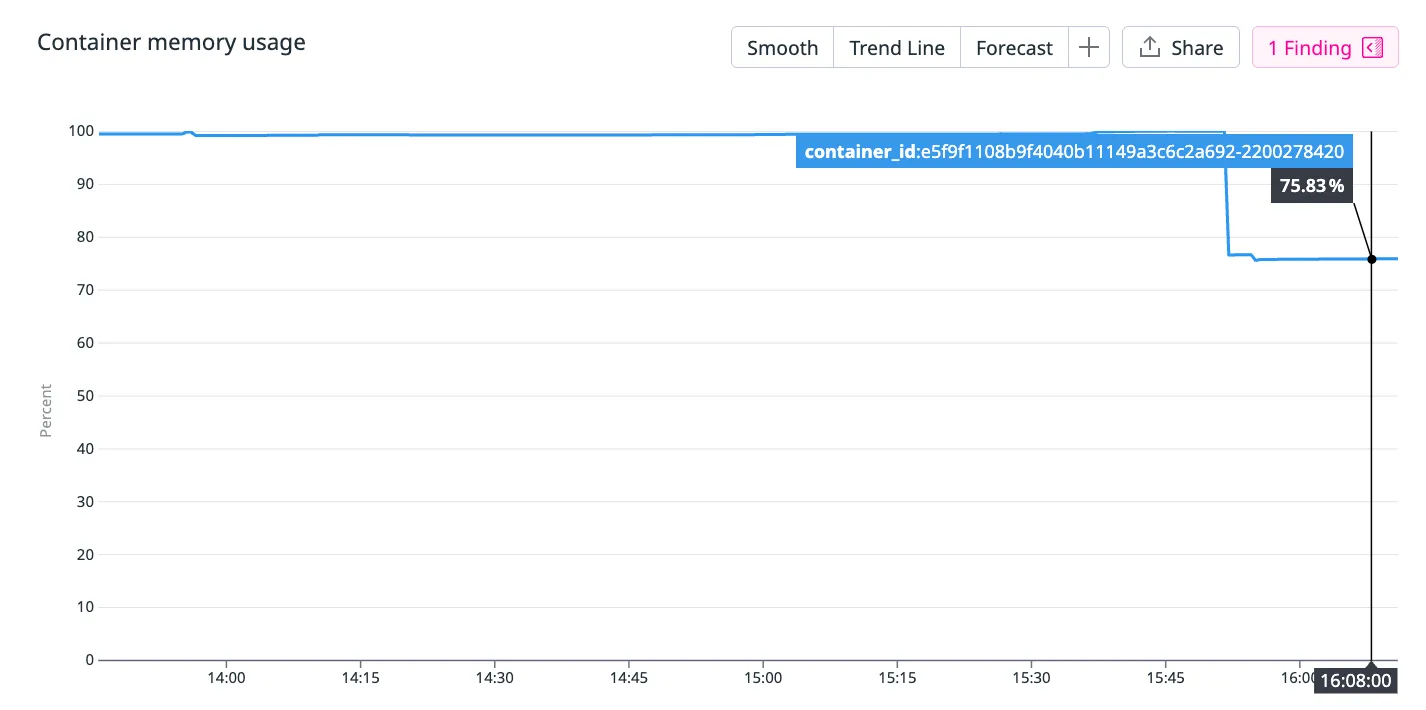
But what actually happened is the memory usage just drops back down to 75.83%… The container didn’t crash and continue to server traffic as usual. The performance of the container didn’t degrade in any noticeable way.
Why does this happen?
Modern Ruby runtimes are capable of returning memory back to the host. And this is exactly what it does when the host has no more memory to claim from.
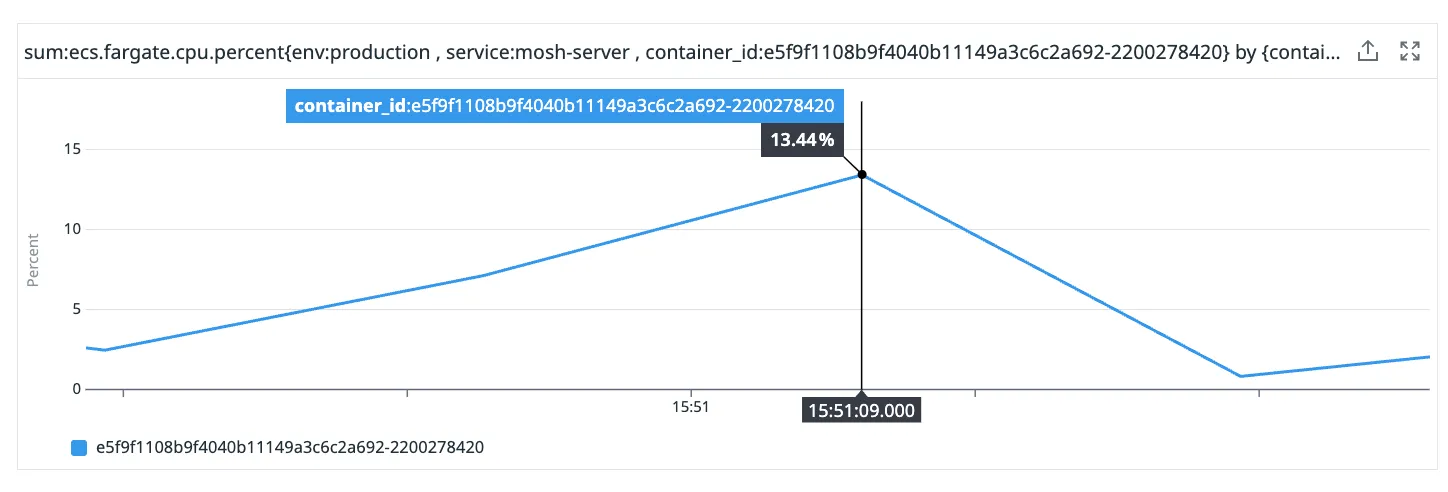
You can see that there was a small spike in CPU around the same time that the memory usage went from 100% to 75%. This is Ruby’s garbage collection process consuming additional CPU.
This is an interesting relationship between memory and CPU that you often see in garbage collected languages. Your runtime can claim back memory at the cost of some temporary CPU usage.
Auto-scaling on memory?
Looking across the entire cluster, we can see that memory usage in every container is gradually creeping up to 100% with occasional intervals of memory reduction.
This is normal, expected behaviour in a Ruby runtime and no matter how much memory you allocate to your container, you will see the same behaviour.
Knowing this, if you set an auto-scaling rule to create new containers when the average container memory usage hits say, 70%, what would you expect to happen?
Well, each container will tend to grow its heap toward the container memory limit until GC pressure forces it to release memory. So over time we would expect every container’s memory usage to reach near 100%. Therefore we would expect to see more and more containers created due to the containers “running out of memory”.
And that’s exactly what happens.
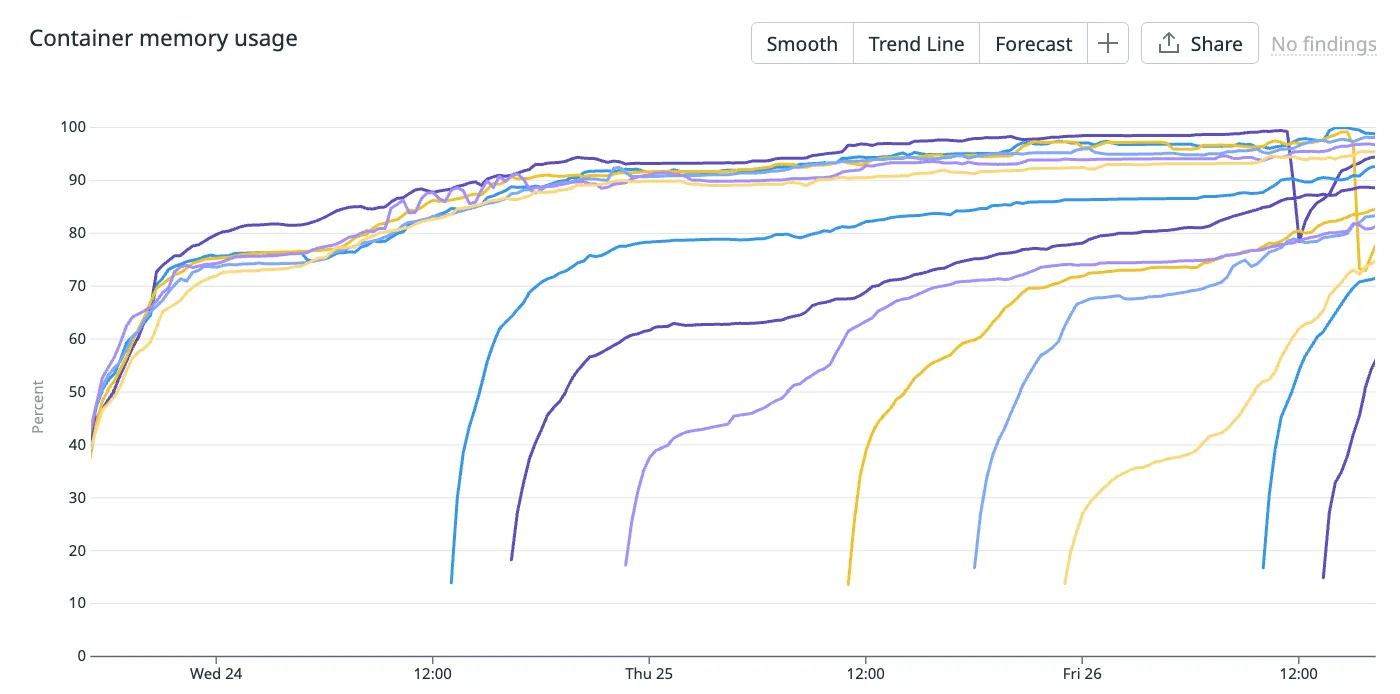
You can see more containers being created in this cluster due to the memory auto-scaling, despite the cluster not being memory saturated.
So what metric should I use to auto-scale?
If your runtime is able to trade memory for CPU, then at what point are you actually memory saturated? Well you can’t just look at 1 metric.
CPU time spent garbage collection is time not spent serving traffic. So if your container is at 100% memory usage and is spending 100% of its CPU resources garbage collecting, then you can consider your container memory saturated.
So it might make sense to monitor how frequently your application is garbage collecting and how long it spends doing it. It also might make sense to monitor CPU usage more closely, since large memory operations result in higher CPU.
The point is, you can’t look at container memory usage alone. Memory is a capacity metric, not a saturation metric.
Java runtime
The Java runtime is even more egregious. If you take a peek into your container’s memory usage, it almost looks fake!
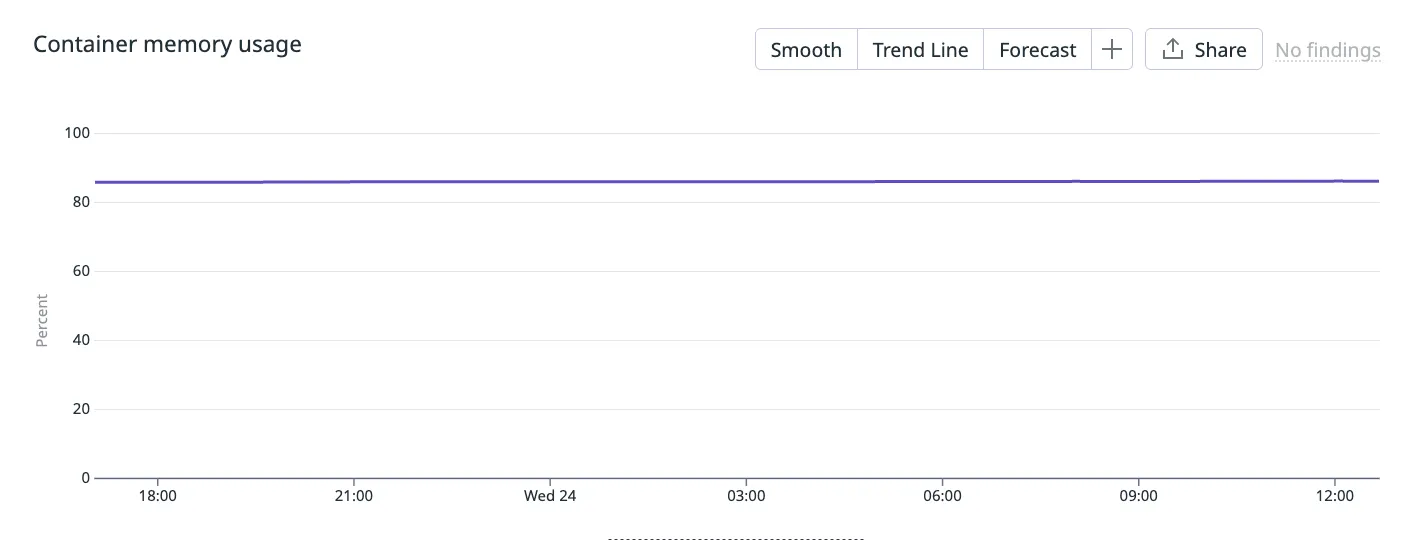
Is my container really only using a static amount of memory in a 24 hour period? Well from the container’s perspective, yes.
When a Java application begins, the JVM will claim a fixed amount of heap memory from its host. The maximum and minimum amount of heap memory the JVM will use is configurable with the -Xmx and -Xms Java options. This particular container has the same maximum and minimum values, hence why the memory usage appears static from the container’s perspective.
Note that even without special configuration, in modern, container-aware JVMs, the JVM will set a sensible maximum heap memory based on the host’s resources and you will see memory usage never exceed a certain amount of container’s available memory.
When we look internally at the JVM’s metrics, we can see how it is actually using this memory.
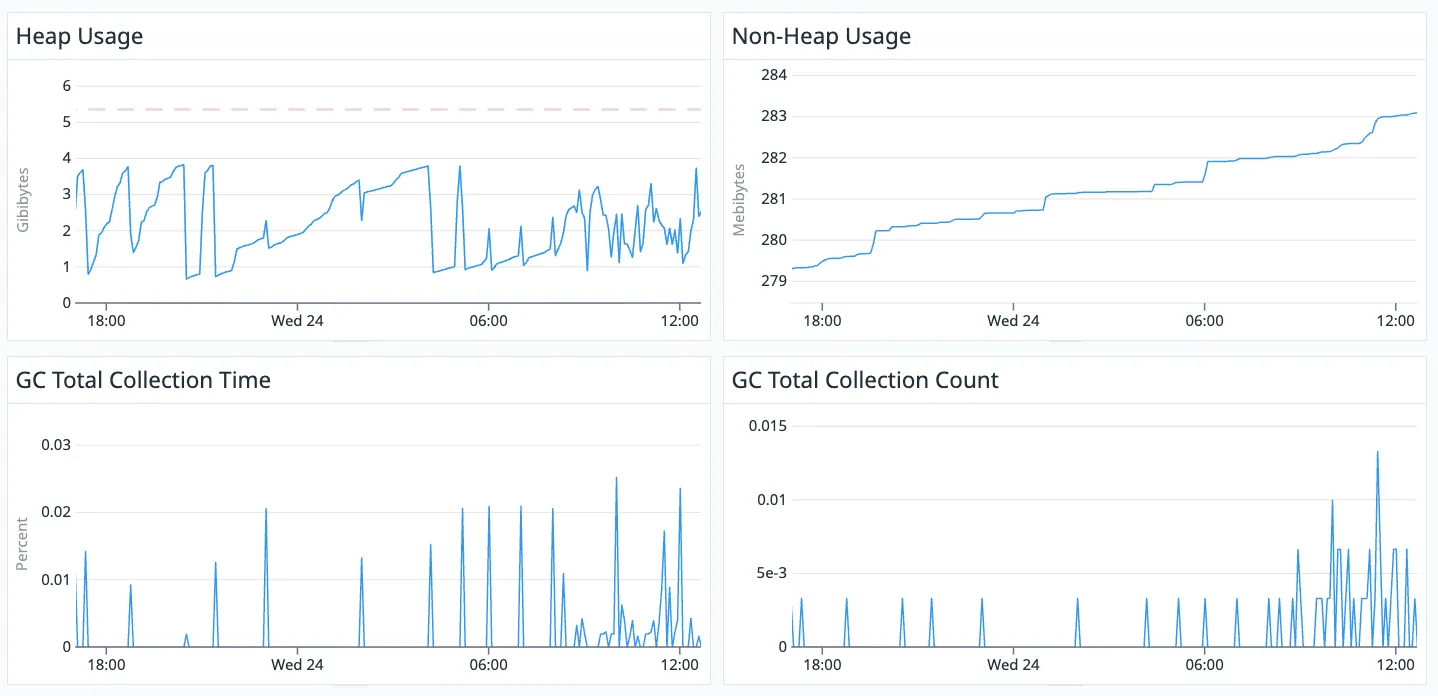
The red, dotted line in the top left graph shows the static amount of heap memory claimed by the JVM, whereas the line underneath shows what is actually being used.
You can see that non-heap memory is not static from the container’s perspective but only fluctuates a few megabytes each day. It is relatively static.
So for a Java runtime, auto-scaling off of container memory makes even less sense since its memory usage from the container’s perspective is nearly static.
Node.js runtime
Node.js is similar to Ruby in that it will garbage collect when the V8 engine determines it “best” based on how much memory pressure your application is experiencing.
So again, looking at container memory usage alone is not enough to determine how saturated your Node.js application is of memory.
Summary
Auto-scaling based on memory might feel useful.
“When my application starts to run out of memory, I will spin up more containers so that the application has more memory to use!”
But as we have learnt, container memory usage is often not an indicator that your application is running out of memory. So you just end up scaling your containers unnecessarily.
Before implementing an auto-scaling rule based on memory, you should pause, take a breath, understand how your runtime uses memory and make sure you aren’t being lied to!